Horizontal pod scaling in Kubernetes using KEDA
Published on Sep 17
When working with Kubernetes, scaling your application up and down to meet real-time demand is a necessity. Kubernetes Event-Driven Autoscaling (KEDA) is a great tool you can use to make that happen. KEDA extends Kubernetes’ native Horizontal Pod Autoscaler (HPA) capabilities to provide dynamic, event-driven scaling.
In this post, I want to check out KEDA’s possibilities combined with what I already discussed in my post regarding ReplicaSets, Deployments and DaemonSets and MetalLB. Combining what we discussed in these two posts with KEDA, we’ll be able to automatically create replicas based on the application’s load and loadbalance the traffic across these replicas.
What is KEDA?
Before diving into KEDA, let’s take a moment to understand what it does and how it works. KEDA is a Cloud Native Computing Foundation (CNCF) project, signifying its maturity and strong backing from a diverse community of contributors, users, and organizations.
To grasp the concept of KEDA, let’s draw a comparison through a simple analogy. Imagine that you own a cozy restaurant. Your restaurant experiences varying levels of customer traffic throughout the day. In the early afternoon, there are only a few customers, but as evening approaches, your restaurant suddenly becomes crowded, with eager customers lining up outside.
In this case, you need to make sure everyone gets a table quickly. To make sure everyone gets to have dinner, you can open a few more tables on the outdoor terrace.
Now, think of KEDA as the manager for your restaurant, but in the world of applications hosted on Kubernetes. As your application sees increased user activity, KEDA automatically scales capacity by adding more “tables” (in this case, Kubernetes pods) to effectively manage workloads. And just like you clean up and store those extra tables after dinner, KEDA will readjust your application when demand drops, optimizing resource usage.
Essentially, KEDA acts as a manager for your application, ensuring it always has the right amount of resources to serve users effectively, just like you manage seats in your restaurant to serve hungry customers.
Deploying KEDA
Let’s jump into the exciting part – deploying KEDA! To get started, we’ll need to add the ‘kedacore’ Helm repository. You can do this by running the following command:helm repo add kedacore https://kedacore.github.io/charts.
Once you’ve added the repository, make sure to update your Helm repositories to ensure you have access to the latest versions of the charts. Execute this command: helm repo update.
With the repositories up to date, you can now proceed to install the KEDA Helm chart into your Kubernetes cluster. Here’s the command to do that: helm install keda kedacore/keda --namespace keda --create-namespace
Using KEDA
Once KEDA is up and running in your Kubernetes cluster, we can start autoscaling our applications.
Deploying a demo application
First things first, if we want to try out KEDA, we need an application to autoscale. For the sake of this post, we’ll be using a simple NGINX deployment. Adding a service of the LoadBalancer type (using MetalLB to load balance the traffic) allows us to distribute the traffic across every replica in the deployment.
apiVersion: apps/v1
kind: Deployment
metadata:
  name: nginx-deployment
  labels:
    app: nginx
spec:
  replicas: 1
  selector:
    matchLabels:
      app: nginx
  template:
    metadata:
      labels:
        app: nginx
    spec:
      containers:
        - name: nginx
          image: nginx
          resources:
            requests:
              memory: 128Mi
              cpu: 100m
---
apiVersion: v1
kind: Service
metadata:
  name: nginx-service
  annotations:
    metallb.universe.tf/address-pool: production
spec:
  type: LoadBalancer
  selector:
    app: nginx
  ports:
    - protocol: TCP
      port: 80
      targetPort: 80
You can apply this Kubernetes manifest and describe the newly created deployment. Take a good look at the amount of replicas, it should be set to 2. This will be important in the future.
[vdeborger@node-01 ~]$ kubectl apply -f nginx-deployment.yaml
deployment.apps/nginx-deployment created
service/nginx-service created

[vdeborger@node-01 ~]$ kubectl describe deployment nginx-deployment
Name:                   nginx-deployment
Namespace:              default
CreationTimestamp:      Wed, 06 Sep 2023 15:24:25 +0200
Labels:                 app=nginx
Annotations:            deployment.kubernetes.io/revision: 1
Selector:               app=nginx
Replicas:               2 desired | 2 updated | 2 total | 2 available | 0 unavailable
StrategyType:           RollingUpdate
MinReadySeconds:        0
RollingUpdateStrategy:  25% max unavailable, 25% max surge
...
Events:
  Type    Reason             Age   From                   Message
  ----    ------             ----  ----                   -------
  Normal  ScalingReplicaSet  15s   deployment-controller  Scaled up replica set nginx-deployment-7b8fdcf699 to 2
Setting up KEDA to scale based on CPU usage
KEDA has 62 different types of scalers (at the time of writing this post), each of these can be used to autoscale your application. I want to keep things simple for this post, so I’ll be showing how you can use the “CPU” scaler.
In order to retrieve a pod’s cpu or memory metrics, KEDA uses the Kubernetes Metrics Server. This component is not installed by default on most Kubernetes deployments. You can check this by executing the following command:
[vdeborger@node-01 ~]$ kubectl get deploy,svc -n kube-system | egrep metrics-server
deployment.apps/metrics-server           1/1     1            1           5d
service/metrics-server       ClusterIP   10.43.141.93   <none>        443/TCP                  5d
If the output of the command is different than the output shown above, you probably need to install the Kubernetes Metrics Server. This can be done by executing the following command: kubectl apply -f https://github.com/kubernetes-sigs/metrics-server/releases/latest/download/components.yaml.
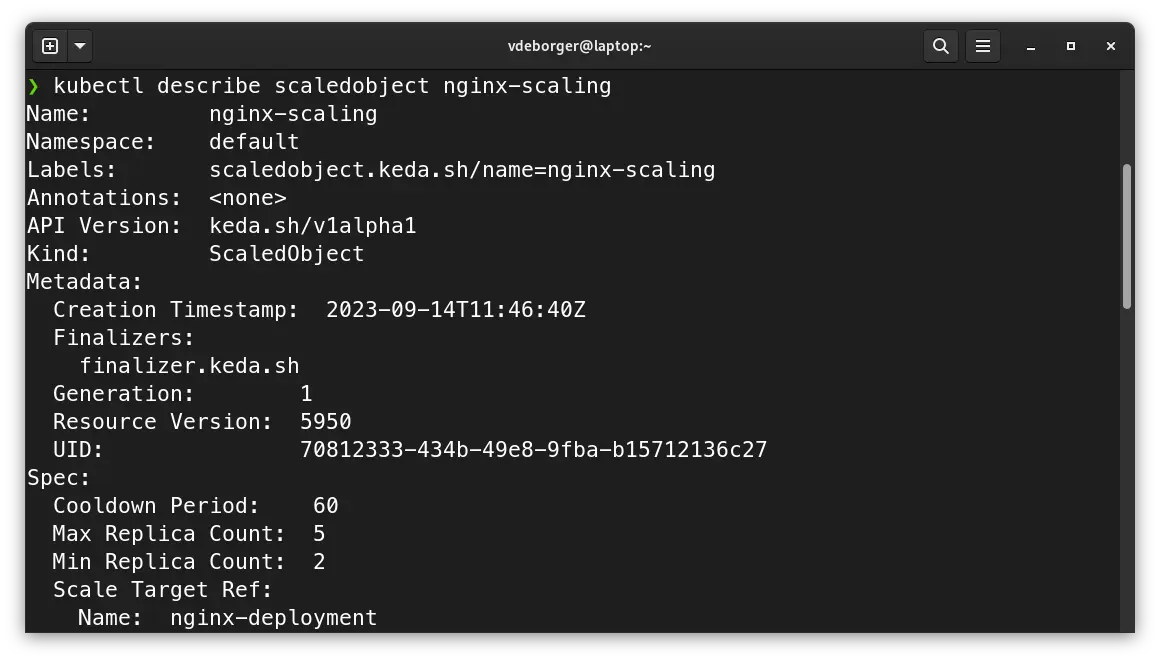
We can scale an application by creating a Kubernetes resource called “ScaledObject” (this is a Custom Resource Definition that gets installed when you install KEDA). This resource allows you to define the scaling properties for your application. You can set the cooldown period, the min and max replica count, a reference to the application you want to scale and which triggers you want to use. In the example below, I’ve created a very simple scaling object. This object scales the application with the name “nginx-deployment” (the demo application we deployed earlier on has the same name) from 2 replicas (min) to 5 replicas (max) based on the CPU utilization. Once the CPU utilization of the 2 “base” replicas is higher than 50%, KEDA will automatically create new replicas in order to distribute the load.
apiVersion: keda.sh/v1alpha1
kind: ScaledObject
metadata:
  name: nginx-scaling
  namespace: default
spec:
  cooldownPeriod: 60
  minReplicaCount: 2
  maxReplicaCount: 5
  scaleTargetRef:
    name: nginx-deployment
  triggers:
    - type: cpu
      metricType: Utilization
      metadata:
        value: "50"
NOTE: One very important thing to note here is that when using cpu or memory scalers, you need to define a resource block with cpu and memory requests.
Stress testing our application to see KEDA in action
With the ScaledObject now configured, we can see KEDA in action by simulating some load on our demo application. To generate this load, we’ll be using a small tool called baton developed by American Express, which can send thousands of requests to a specified URL.
In order to send load to the application, we’ll need the load balancer’s address. Since we’re using MetalLB in this post, we can easily retrieve it from the nginx-service we created before. Executing the following command, should return the load balancer’s IP address: kubectl get service nginx-service -o jsonpath='{.status.loadBalancer.ingress[0].hostname}'.
Once you have the IP address, you can execute baton: ./baton -u http://<load_balancer_ip>:8080 -c 10 -t 120. This command will send a couple thousand request to the demo application, generating load on the CPU. This CPU load will be picked up by KEDA and will scaled our Kubernetes deployment, you can see this by describing the nginx-deployment deployment.
[vdeborger@node-01 ~]$ kubectl describe deployment nginx-deployment
Name:                   nginx-deployment
Namespace:              default
CreationTimestamp:      Wed, 06 Sep 2023 15:24:25 +0200
Labels:                 app=nginx
Annotations:            deployment.kubernetes.io/revision: 1
Selector:               app=nginx
Replicas:               4 desired | 4 updated | 4 total | 4 available | 0 unavailable
StrategyType:           RollingUpdate
MinReadySeconds:        0
RollingUpdateStrategy:  25% max unavailable, 25% max surge
...
Events:
  Type    Reason             Age    From                   Message
  ----    ------             ----   ----                   -------
  Normal  ScalingReplicaSet  5m42s  deployment-controller  Scaled up replica set nginx-deployment-7b8fdcf699 to 2
  Normal  ScalingReplicaSet  25s    deployment-controller  Scaled up replica set nginx-deployment-7b8fdcf699 to 4 from 2
You can also see that there are 4 replicas of our nginx deployment now:
[vdeborger@node-01 ~]$ kubectl get pods --selector=app=nginx
NAME                                READY   STATUS    RESTARTS   AGE
nginx-deployment-7b8fdcf699-29mq5   1/1     Running   0          5m32s
nginx-deployment-7b8fdcf699-5gwrv   1/1     Running   0          15s
nginx-deployment-7b8fdcf699-7mjnb   1/1     Running   0          15s
nginx-deployment-7b8fdcf699-pwpdd   1/1     Running   0          5m32s
Once baton finishes sending load to the application, you will notice that KEDA will scale the application back down to 2 replicas.
kubectl describe deployment nginx-deployment
Name:                   nginx-deployment
Namespace:              default
CreationTimestamp:      Wed, 06 Sep 2023 15:24:25 +0200
Labels:                 app=nginx
Annotations:            deployment.kubernetes.io/revision: 1
Selector:               app=nginx
Replicas:               2 desired | 2 updated | 2 total | 2 available | 0 unavailable
StrategyType:           RollingUpdate
MinReadySeconds:        0
RollingUpdateStrategy:  25% max unavailable, 25% max surge
...
Events:
  Type    Reason             Age    From                   Message
  ----    ------             ----   ----                   -------
  Normal  ScalingReplicaSet  12m    deployment-controller  Scaled up replica set nginx-deployment-7b8fdcf699 to 2
  Normal  ScalingReplicaSet  6m58s  deployment-controller  Scaled up replica set nginx-deployment-7b8fdcf699 to 4 from 2
  Normal  ScalingReplicaSet  13s    deployment-controller  Scaled down replica set nginx-deployment-7b8fdcf699 to 2 from 4
That’s it 🙌! Our application is now capable of scaling up and down based on the CPU load of our pods.
Next steps?
As mentioned earlier, aside from the CPU scaler discussed in this post, there are approximately 62 different types of scalers available for various use cases. It’s worth exploring these options to find the one that best fits your needs. Here are a few examples:
- CRON scaler: this scaler enables you to schedule when your Kubernetes pods should automatically scale up or down based on predefined CRON expressions.
- Loki scaler: with the Loki scaler, you can automatically scale Kubernetes pods based on log events generated by Loki. It allows you to dynamically adjust the pod count in response to specific log patterns or conditions.
- Memory scaler: similar to the CPU scaler we discussed in this post, the memory scaler uses memory metrics instead of CPU metrics to automatically scale your pods up or down.
- Prometheus scaler: this scaler allows you to dynamically scale your Kubernetes pods based on custom metrics collected by Prometheus.